Nick Ciervo

Data

The following was conducted using Python in conjunction with the Twitter API. All of the research done in this manner was carried out by myself strictly out of curiosity without the instruction of any organization or entity.

The fairly neutral (somewhat positive) state of America

Meaning, Methodology, Map, Figure 2, Figure 3, Figure 4, Figure 5, Figure 6

In the days leading into the 2018 U.S. midterm elections, tweets mentioning “Trump” were fairly neutral. To reiterate, those were tweets that mentioned “Trump” and not necessarily Tweets about him.

Of that Tweets that were “polarized”, there were more positive Tweets than negative Tweets, however the negative Tweets were more polarized than the positive Tweets.

Out of 66,802 Tweets collected, 44502 contained location data, and 26,013 were confidently attributed to being from the United States. That does not mean the rest were not, but that their location was not definitively verifiable.

Figure 1: Tweets mapped across the world – focused on the U.S.

The average polarity score for Tweets originating from the United States was 0.035 while all Tweets worldwide (including the U.S.) averaged 0.028. The scale the scores were based on was from 1.0 (most positive) to -1.0 (most negative).
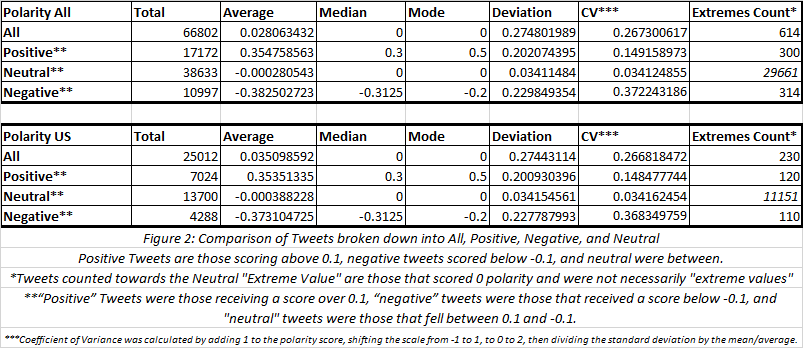
Polarity Chart
Figure 2: Comparison of Tweets broken down into All, Positive, Negative, and Neutral

Overall, Tweets originating from the U.S. tended to be slightly more positive than all the collected Tweets combined.

However, over 81% of the “neutral” rated tweets that originated from the U.S. received a score of “0” versus a little less than 77% from all. This implied “neutral” tweets from the U.S. were more like to be “truly neutral” than the rest, even though both sets were incredibly likely to be “truly neutral”.

Aside from the totals and the mentioned differences, the Tweets from the U.S. were a consistent sample of all tweets. In all other calculations the difference between the two set was less than a percentage point – if there was a difference.

In both sets, the overall average was on the positive side of 0, even though they still fell in the neutral range. However, their “negative” tweets were more likely to be extreme and the absolute value (distance from “0”) of their average score was greater than the absolute value of the average score of their “positive” tweets.

Only 0.92% of the Tweets from both sets received a polarity scale score from one of the extreme ends of the scale (1.0 or -1.0).

The differences were more apparent when broken down by U.S. state (and D.C.), but still weren’t drastic as every state’s average polarity score still fell into the “neutral” range. The “neutral” tweets of most states represented over 50% of their totals, with except to Wyoming and Delaware, but more on them later.
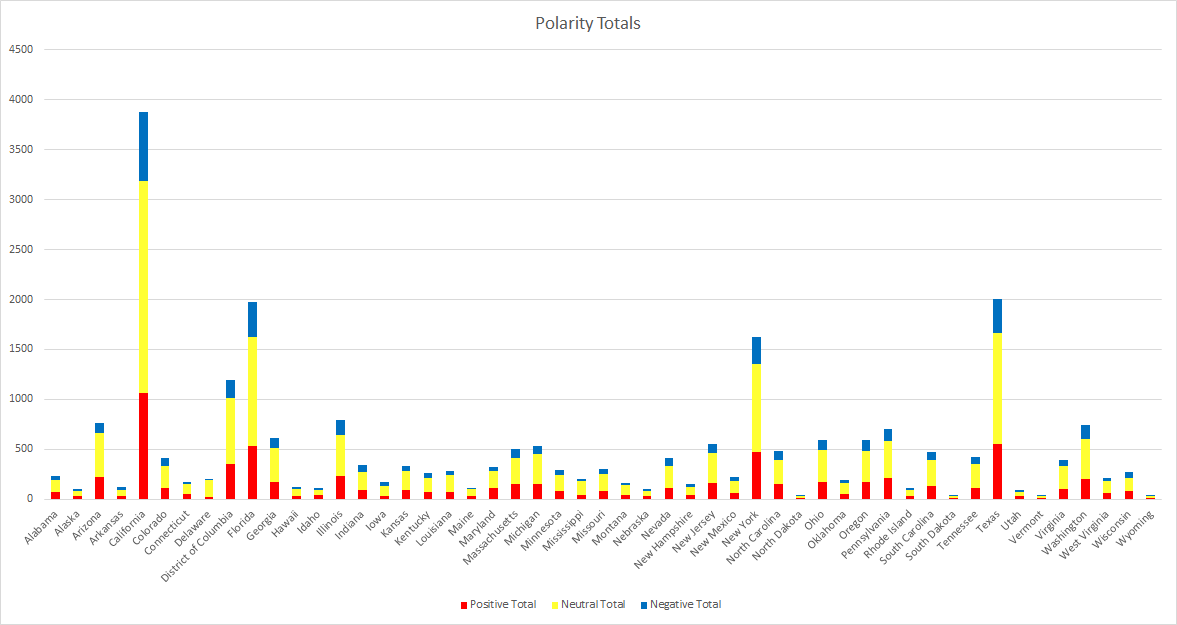
Tweets Totals by State and Polarity
Figure 3: Total number of tweets by positive, neutral, and negative, and by state.
Percentage of Each Polarity by State
Figure 4: The percentage of tweets by polarity category for each state.

California claimed the most tweets, nearly double that of Texas, the 2nd most. California, by proxy, also lead in every other Tweet count category. In contrast, North Dakota had the lowest number of “positive” tweets, Wyoming had the “lowest” number of neutral Tweets, and South Dakota had the lowest total and number of “negative” Tweets.

Wyoming was the most diverse state. All three categories had a fairly equal number of Tweets (32% positive, 39% neutral, 30% negative). This was more than likely a product of their low totals (14 positive, 17 neutral, 13 negative).

Delaware on the other hand was the most uniform state. A staggering 80% of their Tweets received a “neutral” rating, where as only 13% were positive and 7% negative. They were one of 9 states whose Tweets did not receive a polarity score from either extreme.
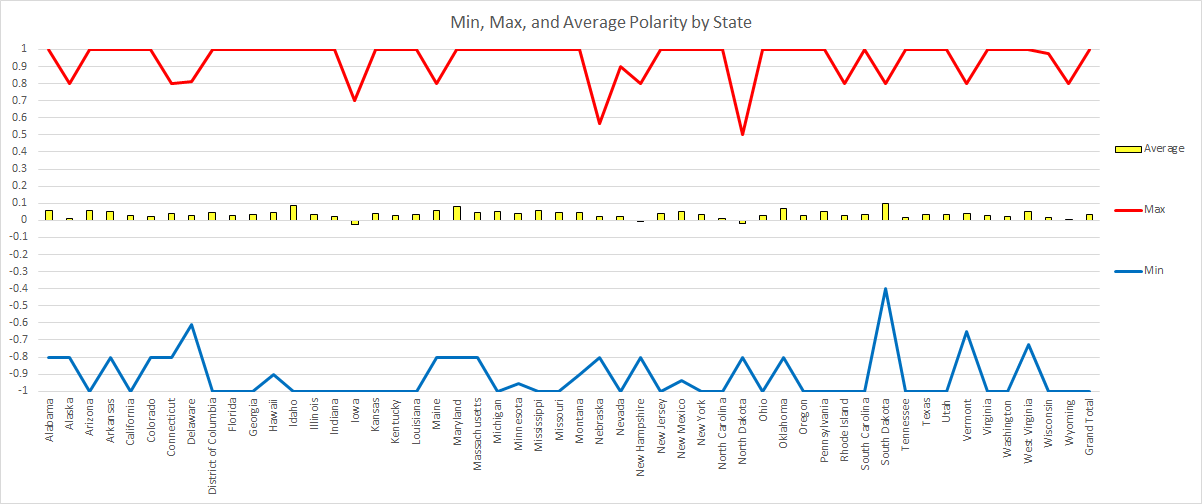
Min, Max, Average Polarity by State
Figure 5: the Min, Max, and Average Polarity by State.

South Dakota’s average tweet polarity almost broke into the positive range (0.0002 points away), but they stayed “neutral”. A total of 48 of the 51 states (and DC) had an average polarity over 0, but below 0.1 – the positive threshold.

No state had an average polarity that was even close to breaking into the negative range. The lowest was Iowa with an average polarity score of 0.0236.

The only other two states with average scores below 0 were North Dakota and New Hampshire, the latter being -0.0006. The variance for the averages was 0.0005, New Hampshire was just about 0.

In total, 26 state had both extremes represented and 42 states had at least one of the two.

South Dakota had the least extreme “negative” Tweet as none were given a polarity score below -0.4. Conversely, North Dakota had the least extreme “positive” Tweet as no polarity score went over 0.5.
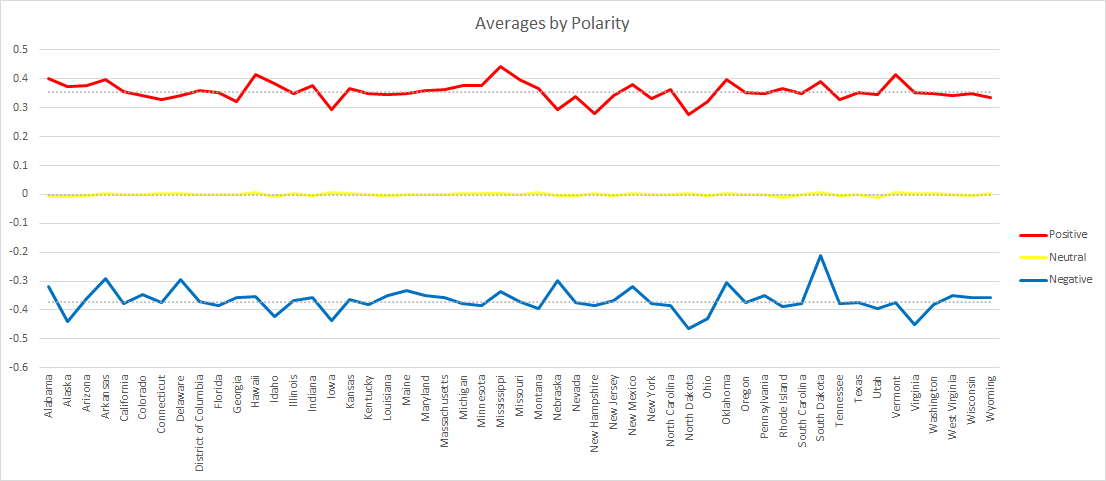
Averages by Category
Figure 6: Shows the averages when taken for each category (positive, neutral, and negative) separately. The national average for each is represented by gray dots.

The average polarity of each of the three categories were consistent within their own. The most consistent were the neutral tweets with an average of -0.00017, a median of -0.00014, standard deviation of 0.000016, and a variance of 0.00396.

The state whose average polarity score was the closest to the national average and matched the national median was Colorado. This would suggest Colorado matched the national sentiment.

Delaware’s “positive” Tweets matched the median and was closest to the average for national “positive” Tweets and Massachusetts did the same for the “neutral” category.

New Hampshire’s “negative” average was the closest to the national “negative” average, while Iowa’s “negative” average matched the median. This was the only category that had different states for the average and the median, a product of having the lowest total but the highest absolute value.

Although South Dakota had the highest overall average, Wyoming had the highest average in all three categories (“positive”, “neutral”, and “negative”).

The state whose “negative” average was the most negative was North Dakota. This is consistent with having the lowest “positive” average, but not with Iowa claiming the most negative overall average.

So, what does it all mean?

Well, for one take these results with a grain of salt. Between the technical complications experienced, function of the sentiment analysis tool, and the difficulty in extracting accurate location data from user inputs (all of which can be read about in more detail in the methodology section), there is a good change these results may have an unintentional bias or skewed. Even if the results are accurate, this is only one social media platform – the most public one.

However, if these results are accurate, then perhaps the United States isn’t as divided as proposed narrative concerning modern political discourse. Certainly, there are social media filter bubbles and polarization. It isn’t unfathomable that the most extreme voices are the most likely to cut through the noise as extremism can equate to conviction.

From every angle, these results suggest the mass political discourse is neutral and those that do participate in polarized speech do so in a more positive manner. Of the nearly 67K tweets, over ¾ of them scored between 0.1 and -0.1 on the polarity scale. Of those that score beyond those thresholds, their average was significantly closer to 0 than their polar ends (1 and -1).

This is not to say there isn’t divisive speech as there were still Tweets spread throughout the range including those along the ends of the spectrum, but the latter only made up 0.92% of the total. For every Tweet that received a 1 (most positive) or a -1 (most negative), there were 48 that received a score of 0, or “true neutral”.

The message here isn’t that there is nothing to worry about. Political discourse seems fairly divisive and combative, but perhaps it isn’t as apocalyptic as commentators suggest.

Methodology

First, I wrote a script to mine data from Twitter. Last time I saved the incoming stream directly to a JSON file without any processing. This resulted in files that were 2gb per 500 Tweets. That would have been over 240gb of JSON files for number of Tweets I collected this time.

This time I wrote the script to pull specific data from the incoming JSON data and saved it directly to a MySQL database. This was a mistake. Whereas last time the JSON was collected and written directly to my hard drive, this time the script had an extra 200 lines of code processing the incoming JSON before writing it. Tweets filtered for “Trump” were coming in more quickly than the script could process them.

To make a long story short, the script broke. It didn’t kick back with an error message, it just broke. I had the script wrapped in a “While 1” loop that would just loop an infinite number of times until I did the manual keyboard interrupt. The script listening to the Twitter stream was done using a “For” loop – “For tweets in stream”. I had print functions scattered throughout the script for troubleshooting purposes. The “For” loop was flanked by two other print functions; one to state that the script was starting and at the very end I wrote one saying it was ending.

The script would start. I would watch as it returned the various data that I had written it to print. Somewhere between the 150th to 200th Tweet the script would take a long pause. Then, it would stop printing the Tweet data and just rapidly loop through the “starting” text and “ending” text. I wrapped the “For” loop in a “Try” and “Except” and wrote it in to print the error message should there be one, but there wasn’t. No exception, no error message, it simply decided to completely ignore the “For” loop. This caused the data to be collected at irregular intervals, as it couldn’t be set and forgotten – it needed some babysitting.

Next, the text of the Tweet ran through a sentiment analysis Python module named “TextBlob”. One of the limitations of many sentiment analysis tools is that they perform word by word analysis. It splits text into individual words, gives each word a rating from 1 to -1 and averages it out at the end. That means a sentence such as, “Nazis are bad,” would come out negative because of the lack of positive words.

The next step was locating the Tweets. During the processing of the JSON data, the script was written to search for both coordinates and location data. First, it searched for any hardcoded location information, city, state or region, and/or country.  If that information wasn’t present, it’d look or user inputted location data – which would become problematic later because of my own negligence. In total it found location data for 44,501 tweets and did not find any location data for 22,027.

For mapping purposes, the data was uploaded to a Google Fusion table. Only 9 Tweets had coordinates attached to them. However, Google Fusion tables have an option to geocode data. It even produces a map for you. The caveat is if you want to use the map for anything, you must publicly share it.

For doing state by state analysis, I wrote a script to go through the location of each Tweet searching for state names and abbreviations. It didn’t work perfectly. Some of North Carolina ended up in South Carolina’s, same thing with the Dakotas, and some Tweets got completely skipped over.

But that wasn’t the worst of it. The worst was processing state abbreviations. First, there was an incredible amount of discrepancy in the way people abbreviated. Some people put periods between the initials, others didn’t, a handful did half and half. Secondly, many state abbreviations are simple words – like Indiana (IN) and Oregon (OR). Needless to say, data cleaning for over 44,000 tweets was time consuming.

Finally, the data was export from MySQL into a CSV which was subsequently turned into an XLSX. A pivot table was created to get the state by state averages and counts. Averageifs and countifs were used to get separate out the positive, negative, and neutral Tweets. Index matches were used to find states that matched the average, media, min, and max. And charts were made to visualize the data.
Top

Tweets from the Arctic Circle

Introduction

This experiment was inspired by a PhD call from the University of Oulu. The purpose was to see how people in the Arctic Circle were using Twitter. Python was used to scrape Twitter for Tweets from between the coordinates of 66.5N,180W and 90N,180E. In part, the experiment was a failure as the usable collected sample was not enough to make any conclusive insights. However, the reasons why only a small sample was used provide their own insights.

The experiment was conducted over the course of a week. It wasn’t anticipated to be overly inundated with data. For one, not every Twitter user shares their location data. Secondly, and probably the most influential, it isn’t unprecedented for sparsely populated areas to be neglected in the development of information-communication technology (ICT) networks. In many of these areas it is deemed that the cost to develop ICT networks outpaces the potential for reaching new consumers (Kunst, 2014). Not only is life sparser in the northern limits, there may be depopulation to contend with as is what is happening to Sweden’s northern rural regions (Carlsson & Nilsson, 2016). This isn’t to say that the ICT architecture of developed nations is comparable to developing nations, but to highlight the low number of results expected and why a collection period of a week was deemed more adequate than a day.

Only 338 of the Tweets collected were deemed usable for the purposes of this study. Further scrutiny would have only acted to in an even lower sample size than what was already deemed inadequate for conclusive remarks. Of the Tweets collected, only 1,680 were definitively from the Arctic Circle. Of those tweets, the top 4 users who tweets the most were bots. With their Tweets removed, the makeup of the results changed drastically, particularly the results concerning languages used. Even though the sample size was not deemed large enough to make any conclusive insights, the experiment was still conducted. There were also many Tweets in the results that came from outside of the Arctic Circle. These Tweets were removed from the results but saved for later analysis. Quickly browsing through the removed tweets, all of them came from locations in which the locations’ bounding box dipped into the Arctic Circle, but that will be expanded upon later.

Results

The script collected Twitter data for a one-week period. Unfortunately, the collection of the data was inconsistent through that week. More details about complications and exactly how this was accomplished are detailed in the methods section. Even after running the script for the week, only 1,680 of the collected tweets containing location data came from inside the Arctic Circle. This confirms the low expectations for results. An additional 1,509 were located outside of the Arctic Circle and a staggering 14,478 of the tweets did not have location data available. Those results were unexpected and since they were not part of the experiment, these tweets were removed but saved to determine why they were collected.

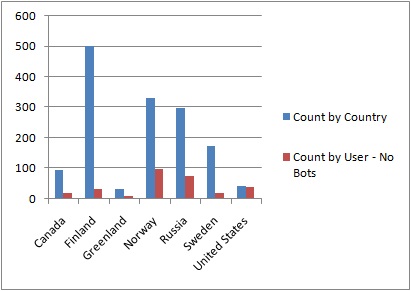
Of the 1,680 results that came from the Arctic Circle, only 1,478 contained country data. In these results, there were 7 unique countries represented (including Greenland which is an autonomous Danish territory) [Figure 3]. The most represented countries were Finland with 503 tweets, Norway (331), and Russia (298. It should not be surprising that the results were dominated by Scandinavian countries as well as Russia considering 20% of the country’s land area is above the Arctic Circle. A heat map of where the Tweets came from is available [Figure 1].

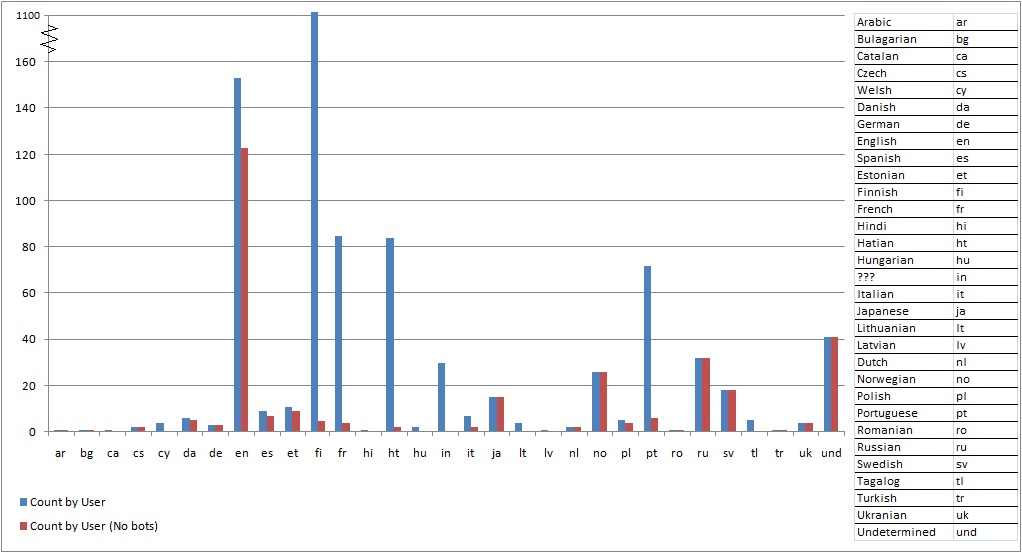
All 1,680 of the tweets contained ISO 639-1 language codes. In total, there were 31 unique language values represented [Figure 4]. The top 5 represented languages were Finnish with 1053, English (153), French (85), Haitian (84), and Portuguese (72). These results made it apparent that the data needed to be scrutinized more greatly. Although French, Haitian, and Portuguese were surprising to see in the top 5, the fact that nearly 2/3 of the results were in Finnish was suspect. It is also important to note that 41 of the posts were undetermined (und) and another 31 were from an ISO code that I could not find the language in which it was correlated (in).

Further analysis of the users who tweeted from the Arctic Circle provided answers for the abnormalities in the language counts. There were 165 unique users represented in the results. Each user tweeted an average of 10.2 times from the Arctic Circle. However, the median tweet per user was 1 and 102 of the users only tweeted once during that week of data collection. Only five users had tweet counts which exceeded the average (997, 282, 40, 23, and 11 tweets respectively). The top 4 users whom tweeted the most were all confirmed bots. By removing the user with the most posts, the average dropped to 4.2 and number of users that exceed the average jumps to 18, but the total number of tweets dropped to 683. Without the top 4 users, the average dropped to 2.1 tweets per user; 38 users exceeded the average for a total of 338 tweets. The top 2 users respectively accounted for 59.3% and 16.8% of the total number of collected tweets.

Without the 4 bots, the heat map, represented countries, and languages all drastically changed. From the heat map [Figure 2], one can see the massive red and yellow square around where Norway, Sweden, Finland, and Russia meet broke up into many localized green and yellow circles. That is because out of the 296 tweets sharing country data, the total number of Tweets from Finland dropped to 53. The countries with the most tweets changed to Norway (99), Russia (76), and the USA (39). These are not very large numbers, which is a result of the low sample size. A larger sample size could easily see a shift in the number of Tweets per country. With Norway and Russia nearly doubling the third place USA, the data was further scrutinized for outlying bots, but none stood out.

The makeup of languages used also changed. The number of unique languages also dropped to 23. English became the most used language with 126 tweets, followed by Russian (32), Finnish (29), Norwegian (26), and Swedish (18). Undetermined (und) remained the same at 41 and the unknown language (in) dropped to 4. Undetermined had a high enough tweet count to be the second most used language, if it were a language.

The results of the top 5 languages after removing the four outlying users more closely reflected that of what was expected. Only seven countries were represented in the data, USA, Canada, Greenland (Denmark), Russia, Finland, Norway, and Sweden. The only country with land that crosses into the Arctic Circle that was not represented in the data was Iceland. Considering the countries that are present in the Arctic Circle, English being the most common language used was anticipated. Two of the countries (USA and Canada) are English native countries. Of the remaining countries, Sweden ranks second in English proficiency, Denmark (Greenland) ranks 3rd, Norway 4th, and Finland 6th (English First, 2017). In other words, the Arctic Circle is made up of two English native countries, four of the top six ranked countries in terms of English proficiency, Russia, and Iceland. The other four languages present in the top used languages are all languages that are native to countries present in the Arctic Circle. Another interesting correlation is the languages, aside from English, are conversely correlated with their host countries English proficiency. Russia’s English proficiency ranks 38 in the world and was the second most used language; Finnish was the 3rd and ranked 6th, Norway was 4th and ranked 4th, Swedish was 5th and ranked 2nd.

Why is this important? The results are too small of a sample to say anything conclusive about the Arctic Circle itself. Unfortunately, in that regards the experiment failed. However, examining why the experiment failed and why it was difficult to obtain an adequate sample comes with its own insights.

First, the Twitter API locations filter was hardly reliable. From the Twitter Streaming API website, the locations filter works so that “only geolocated Tweets falling within the requested bounding boxes will be included.” It would be expected that using the locations filter would only collect tweets that were geolocated between the points -180,66.5 and 180,90 – the arctic circle. As mentioned, even with the filter, 1,509 of my results were located outside of the Arctic Circle and another 14,478 were not geolocated at all. Such results could have been due to a problem in the code if I wasn’t using Twitter’s own filter. In fact, a filter was added to the script after it was noticed that Twitter’s filter wasn’t working as expected. The script’s filter seamlessly separated tweets from the Arctic Circle, tweets from outside the Arctic Circle, and Tweets that were not geolocated into three different CSV files. With that started, the question is, based on Twitter’s own explanation for their locations filter, why was it returning Tweets from outside of the Arctic Circle and non-geolocated Tweets?

In analyzing the other two CSV files (outside Arctic Circle and non-geolocated tweets), a trend became apparent. Most of the countries that dominated those results were the same as the countries from the sample that was used. The exception was Iceland. As already noted, parts of Iceland do peak into the Arctic Circle. The most northern of the geolocated Tweets from Iceland was located at 66.4N. This is not considered to be from the Arctic Circle, but is .1 degree off, which is very close.

At first glance of the JSON generated by the Twitter Streaming API, each tweet had a “place” node with “name” and “country” as separate objects under it. These objects are where the Country and Location of origins for each Tweet are collected. Also under the same “place” node is the “bounding box” object which contains multiple sets of coordinates. Sorting the Tweets by their bounding boxes revealed that Tweets with the same bounding box values were from the same Location Name. Every single one of these locations had at least on bounding box value that peaked into the Arctic Circle. Of the over 16,000 results analyzed this was consistent, even the Tweets that were not geotagged. Regardless of the coordinates of the Tweet or if the Tweet was even geotagged, the Twitter locations filter grabbed Tweets from locations whose bounding boxes overlapped with the filter’s bounding box. That is not how the locations filter was described on the Twitter website.

Secondly, the results show how easily Twitter data can be skewed. The results were drastically changed by four discovered bots, one more so than the others. In the initial analysis of the results, the presence of French and Portuguese top 5 most common languages used in the Arctic Circle was thought of as nothing more than a bizarre coincidence. However, the fact that Finnish made up more than 2/3s of the collected Tweets was suspect. Sure enough, all four of the top users were bots. If scrutinized further, it is almost certain other bots would have been discovered. Even with the removal of the two discovered bots, the results were drastically affected.

There is a feeling in Journalism that even with the influx of computation and algorithms being introduced into the field, they can’t compete with journalistic instincts and the ability to judge newsworthiness (Bucher, 2017). The script worked exactly as it was programmed. The Twitter API worked exactly as it was programmed (even if it was not as expected), and Excel presented the data exactly how it was told. However, it did none of them warned me to look out for users with 25x more Tweets than the average or 997x more tweets than the mean. None of them thought to remove those results. That took human intervention, an eye for patterns, and understanding when something seems off. They worked completely as intended, but they weren’t perfect. That was not due to a fault in their function, but one in their programming. This isn’t an attempt to join the debate that computers won’t one day be autonomous. However, for now they still require human actors acting upon them to behave appropriately and human scrutiny to ensure the correct story is being told.

Methods and Complications

The Twitter streaming API’s locations filter accepts coordinates in quadruples specifying the southwest corner and the northeast corner of the box one wants to search. If the user wanted to search multiple boxes, that is possible. The data needed to be entered as a string, the coordinates entered as integers or floats draw a 406 error from Twitter. The second complication was while most of Twitter is represented with the latitude coordinate first and the longitude coordinate second, for the locations filter it is reversed, so longitude first and latitude second. Instead of using directional signifiers for north, south, east, or west, the Twitter API uses positive and negative values. For example, -180 is 180W and 180 is 180E while -90 is 90S and 90 is 90N.
With all this information, my value for the locations filter was “-180,66.5,180,90”, quotation marks included. -180 is the most western coordinate in this system and 180 is the most eastern. Latitude only goes up to 90, positive numbers represent north, and the Arctic Circle begins at 66.5N. That makes -180,66.5 is the southwestern corner in this experiment and 180,90 is the northeastern corner.

As mentioned, the script ran off and on for a week. I was afraid of obtaining insufficient data if I only ran it for a day. The Twitter API presents data in the JSON format. The script collecting the data output as JSON as well. This was done in case the data was needed for any additions deemed useful for the results after the initial analysis (for example the bounding box data). The first attempt at running the script over a week resulted in accidentally generating a 29gb file. This file was too big to be parsed by Python as it resulted in a MemError and did not open in any of the applications that were on the computer being used. The computer being used only had 12gb of RAM – which is why. There are applications designed specifically for opening large files. Unfortunately, even after opening the file, it was over 6 million lines of JSON. It was decided to scrap the file, change the Python script, and start again. The change made it so after every 500 tweets, the script would begin writing to a new file. The files created this way were generally between 1.7-1.9mb.

Next, a Python script was written to extract the created at, latitude, longitude, location name, country, language, and text of each tweet into a CSV file. In this process there was a complication in how the JSON was stored. On its own, the Twitter streaming API doesn’t enter each Tweet onto their own lines as they were written. As a result, the data came in as one continuous line. Running the script to extract data from each tweet generated “json.decoder.JSONDecodeError: Extra data:” errors, meaning there was more data after the Python script expected the JSON entry to end. On the other hand, using the Tweepy library resulted in extra lines being added between each Tweet. This generated a Python error concerning processing lines that were “none” or “null”. The solution used by this experiment was to run the standard Twitter streaming API but with adding “\n” to the end of every Tweet. In Python, “\n” as a string denotes a return, thus putting each Tweet onto its own line.

While analyzing the resulting CSV files it came to my attention that even though I was filtering for tweets inside of the Arctic Circle, there were many tweets with coordinates outside of the Arctic Circle or even no coordinates at all. After briefly examining the JSON, I have an educated theory as to why this is happening, but that will require a separate experiment. In response, I scrapped the initial CSV file, edited the script parsing the JSON into CSV, and ran the script again. The change I made was a simple IF statement to write any of the latitude values that were greater than or equal to 66.5 to one file, any that were less than to another, and any null values to a third. The coordinate values came in as strings so the variable containing the latitude values needed to be placed in a float() for the IF statement to function properly. Just in case, a ValueError exception was written as a catch all for anything not addressed in the IF statement and those entries were directed to the same file as any null values.

The final complication prevented the script from running consistently. Throughout the week, as I left the script running while I slept or went to work, I would find the script had stopped running and an error message that read, “ConnectionResetError: [WinError 10054] An existing connection was forcibly closed by the remote host”. A solution was not found for this error and the script was simply restarted whenever the error occurred. This resulted in there being large gaps of time missing from the data collection process.

Figures

Figure 1: Arctic Tweets Heatmap:
Figure 2: Arctic Tweets Heatmap without Bots
Chart of Tweets by Country
Figure 3
Chart of Tweets by Language
Figure 4

Works referenced

Bucher, T. (2017). 'Machines don't have instincts': Articulating the computational in journalism. new media & society , 918-933.
Carlsson, E., & Nilsson, B. (2016). Technologies of Participation. Journalism , 1113-1128.
English First. (2017). English Proficiency Index.
Kunst, M. (2014). The Link between ICT4D and Modernization Theory. Global Media Journal